

While surfing weight loss pages on Stumbleupon, I came across this chart:
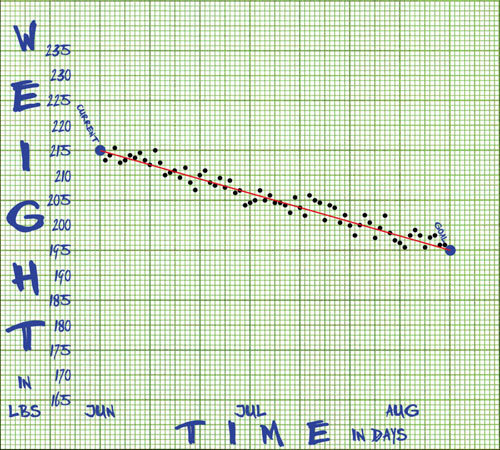
And this was written about it:
“All that you need for my diet is graph paper, a ruler, and a pencil,” Steve would explain. “The horizontal axis is time, one line per day. The vertical axis is weight in lbs. You plot your current weight on the left side of the paper. You plot your desired weight on a desired date towards the right side, making sure that you’ve left the correct number of lines in between (one per day). You draw a line from the current weight/date to the desired weight/date. Every morning you weigh yourself and plot the result. If the point is below the line, you eat whatever you want all day. If the point is above the line, you eat nothing but broccoli or some other low-calorie food.”
And while I would have no plan to ever eat nothing but broccoli for a day, I do already weigh myself every day and thought this would be an easy way to track my ups and downs. And since I already have graph paper for charting my cross stitch patterns, and it was so simple, I charted myself a graph...
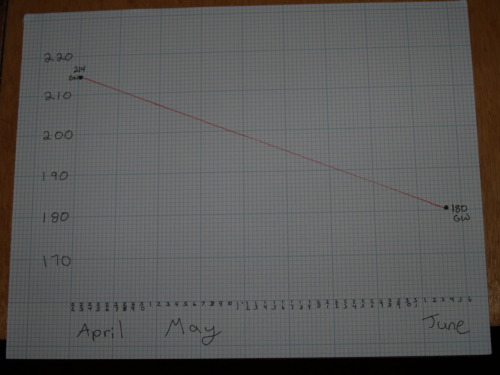
I was at 214 when I made the chart (yesterday) and it goes through to about the 4th of June. I've set my GW to be 180 by June 4, which is 30 pounds gone (about 5 a week between now and then) which may or may not be reachable but.......at least its something to aim for.

And this was written about it:
“All that you need for my diet is graph paper, a ruler, and a pencil,” Steve would explain. “The horizontal axis is time, one line per day. The vertical axis is weight in lbs. You plot your current weight on the left side of the paper. You plot your desired weight on a desired date towards the right side, making sure that you’ve left the correct number of lines in between (one per day). You draw a line from the current weight/date to the desired weight/date. Every morning you weigh yourself and plot the result. If the point is below the line, you eat whatever you want all day. If the point is above the line, you eat nothing but broccoli or some other low-calorie food.”
And while I would have no plan to ever eat nothing but broccoli for a day, I do already weigh myself every day and thought this would be an easy way to track my ups and downs. And since I already have graph paper for charting my cross stitch patterns, and it was so simple, I charted myself a graph...
I was at 214 when I made the chart (yesterday) and it goes through to about the 4th of June. I've set my GW to be 180 by June 4, which is 30 pounds gone (about 5 a week between now and then) which may or may not be reachable but.......at least its something to aim for.


0 comments:
Post a Comment